

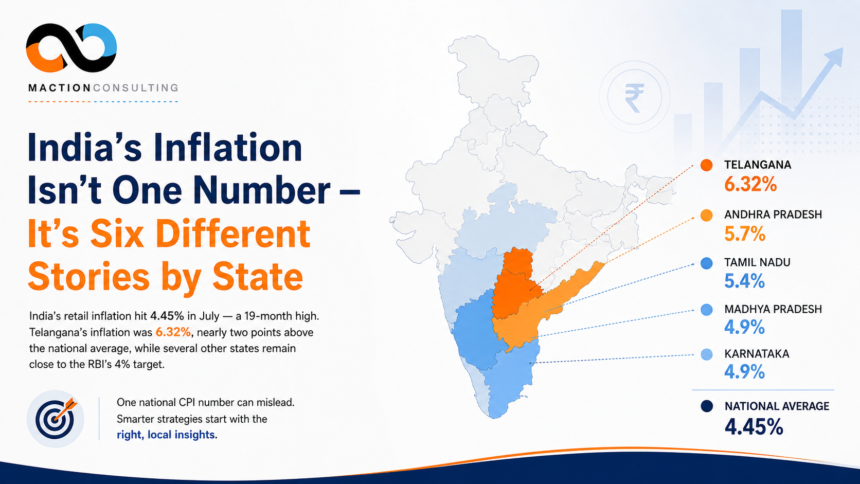
India’s retail inflation hit 4.45% in July, released this week by the National Statistics Office — a 19-month high, and the third straight monthly acceleration. That’s the headline every outlet ran with. The number underneath it that deserves more attention is this: Telangana’s inflation rate for the same month was 6.32%, nearly two full points above the national figure, while several other states sat comfortably close to the RBI’s 4% target. A brand pricing, promoting, or forecasting demand off the national CPI print alone is, in effect, using the wrong number for a large share of its own market.
The State-Level Spread Is Bigger Than It Looks
Southern states led July’s inflation figures by a wide margin:
|
State |
July 2026 CPI Inflation |
|
Telangana |
6.32% |
|
Andhra Pradesh |
5.7% |
|
Tamil Nadu |
5.4% |
|
Madhya Pradesh |
4.9% |
|
Karnataka |
4.9% |
|
National Average |
4.45% |
A nearly two-point gap between Telangana and the national average, within the same month, on the same index, is not statistical noise — it’s a genuinely different inflation environment for consumers in that state. Industry commentary attributes the southern-state pattern to a mix of higher underlying demand alongside elevated logistics costs and local levies, meaning the divergence has both a demand-side and a cost-side driver, not just one.
Where the National Number Is Actually Coming From
Food remains the dominant driver nationally — food inflation climbed to 5.52% in July from 5.32% in June — and economists are explicit that this rise is largely food-driven rather than broad-based, with core inflation excluding volatile categories staying comparatively benign. But two categories are also standing out for reasons directly tied to the ongoing West Asia conflict: transportation inflation and, notably, restaurants and accommodation, where inflation jumped from 6.91% in June to 7.7% in July. That jump is a visible, compounding effect of higher fuel costs working their way into a category most brand trackers don’t treat as inflation-sensitive at all.
Rural Inflation Is Now Running Meaningfully Ahead of Urban
The July data also shows a rural-urban gap worth building into any national tracker: rural inflation came in at 4.84% against 3.96% in urban areas, a gap of nearly a full point, driven mainly by rural households’ heavier weighting toward food in their overall spend. For categories with meaningful rural exposure — FMCG, agri-input, two-wheelers — this is the second consecutive month rural inflation has run visibly ahead of urban, and it reinforces a pattern worth tracking as its own line rather than folding into a single national figure.
Why a Single National Number Misleads Category and Regional Strategy
Most brand and category trackers report a single national price-sensitivity or inflation-perception figure, often benchmarked loosely against the CPI headline number. July’s data makes the case for why that’s an increasingly weak proxy: a brand with concentrated distribution in Telangana or Andhra Pradesh is operating in a materially different — and considerably hotter — inflation environment than one concentrated in states running closer to the national average. Using the national CPI as a stand-in for “how squeezed is my customer” risks either overstating pressure in some markets or badly understating it in others.
What Analysts Are Now Projecting
The forward view has shifted since the RBI’s early-August policy meeting. Economists are now projecting CPI inflation to harden to roughly 4.7% in August and cross 5% in September as favourable year-ago base effects fade, with the full-year average likely landing around 5%, largely attributed to the prolonged West Asia conflict and El Niño-linked monsoon risk. More significantly, at least one prominent economist is now flagging a possible RBI rate hike in December — a genuine shift in tone from the “hold and watch” posture the central bank held as recently as its August meeting, and worth tracking closely given how directly a rate move would affect consumer sentiment heading into the new year.
What to Build Into Research Now
- Report price-perception and spend-intent data at the state or regional level, not just nationally, for any brand with concentrated exposure to the southern states currently running hottest.
- Separate rural and urban inflation-sensitivity questions explicitly, given the gap has now held for two consecutive months rather than appearing as a one-off.
- Add restaurant, dining, and out-of-home spending to inflation-sensitivity tracking, since this category’s inflation is accelerating faster than food itself and is easy to overlook in a standard FMCG-focused tracker.
- Revisit demand forecasts against a 5% (not 4%) inflation assumption for Q3-Q4, given how quickly the consensus view has moved in just the past month.
Frequently Asked Questions
Q: Why did Telangana have higher inflation than the national average in July 2026?
Industry commentary attributes Telangana’s 6.32% July inflation — nearly two points above the national 4.45% — to a combination of higher underlying demand and elevated logistics costs and local levies. The divergence has both a demand-side and a cost-side driver, making it more persistent than a simple seasonal spike.
Q: What is driving India’s inflation in July 2026?
Food inflation is the dominant national driver, climbing to 5.52% in July from 5.32% in June. Additionally, restaurant and accommodation inflation accelerated sharply from 6.91% to 7.7% — a compounding effect of higher fuel costs from the ongoing West Asia conflict working through to consumer-facing categories. Core inflation excluding volatile categories remains comparatively benign.
Q: Is rural inflation higher than urban inflation in India right now?
Yes. July 2026 data shows rural inflation at 4.84% against 3.96% in urban areas — a gap of nearly one full percentage point, driven by rural households’ heavier weighting toward food in their overall spend. This is the second consecutive month rural inflation has run visibly ahead of urban, making it a pattern worth tracking rather than a one-off.
Q: What inflation rate should brands use for Q3-Q4 2026 demand forecasting?
Economists have shifted their consensus view significantly since early August. CPI is now projected to harden to approximately 4.7% in August and cross 5% in September as favourable base effects fade, with the full-year average likely around 5%. Brands should revise demand forecasts built on a 4% assumption — and monitor whether the RBI acts on signals of a possible December rate hike.
The Bigger Point
A single national inflation number is useful for the RBI setting one policy rate for the whole country. It’s considerably less useful for a brand trying to understand how squeezed its actual customers are, because — as July’s data shows clearly — “India’s inflation” is really several different regional and rural-urban stories running at once, with a gap between the hottest and coolest states wide enough to change pricing and promotional decisions on its own. Category and regional research built around this divergence, rather than the single topline figure, will read the next two quarters far more accurately than a national number alone ever could.
If you need state or region-level price-sensitivity research to plan around this divergence, talk to our research team at Maction.